
Subtract the total investment in workplace branding from its attributable financial gains, divide the result by the investment, then multiply by 100 to calculate ROI as a percentage. Calculating ROI on workplace branding means counting both immediate campaign outcomes and longer-term savings, such as reduced recruitment costs when employees stay longer. The calculation is only useful when the benefits can be linked credibly to the investment.
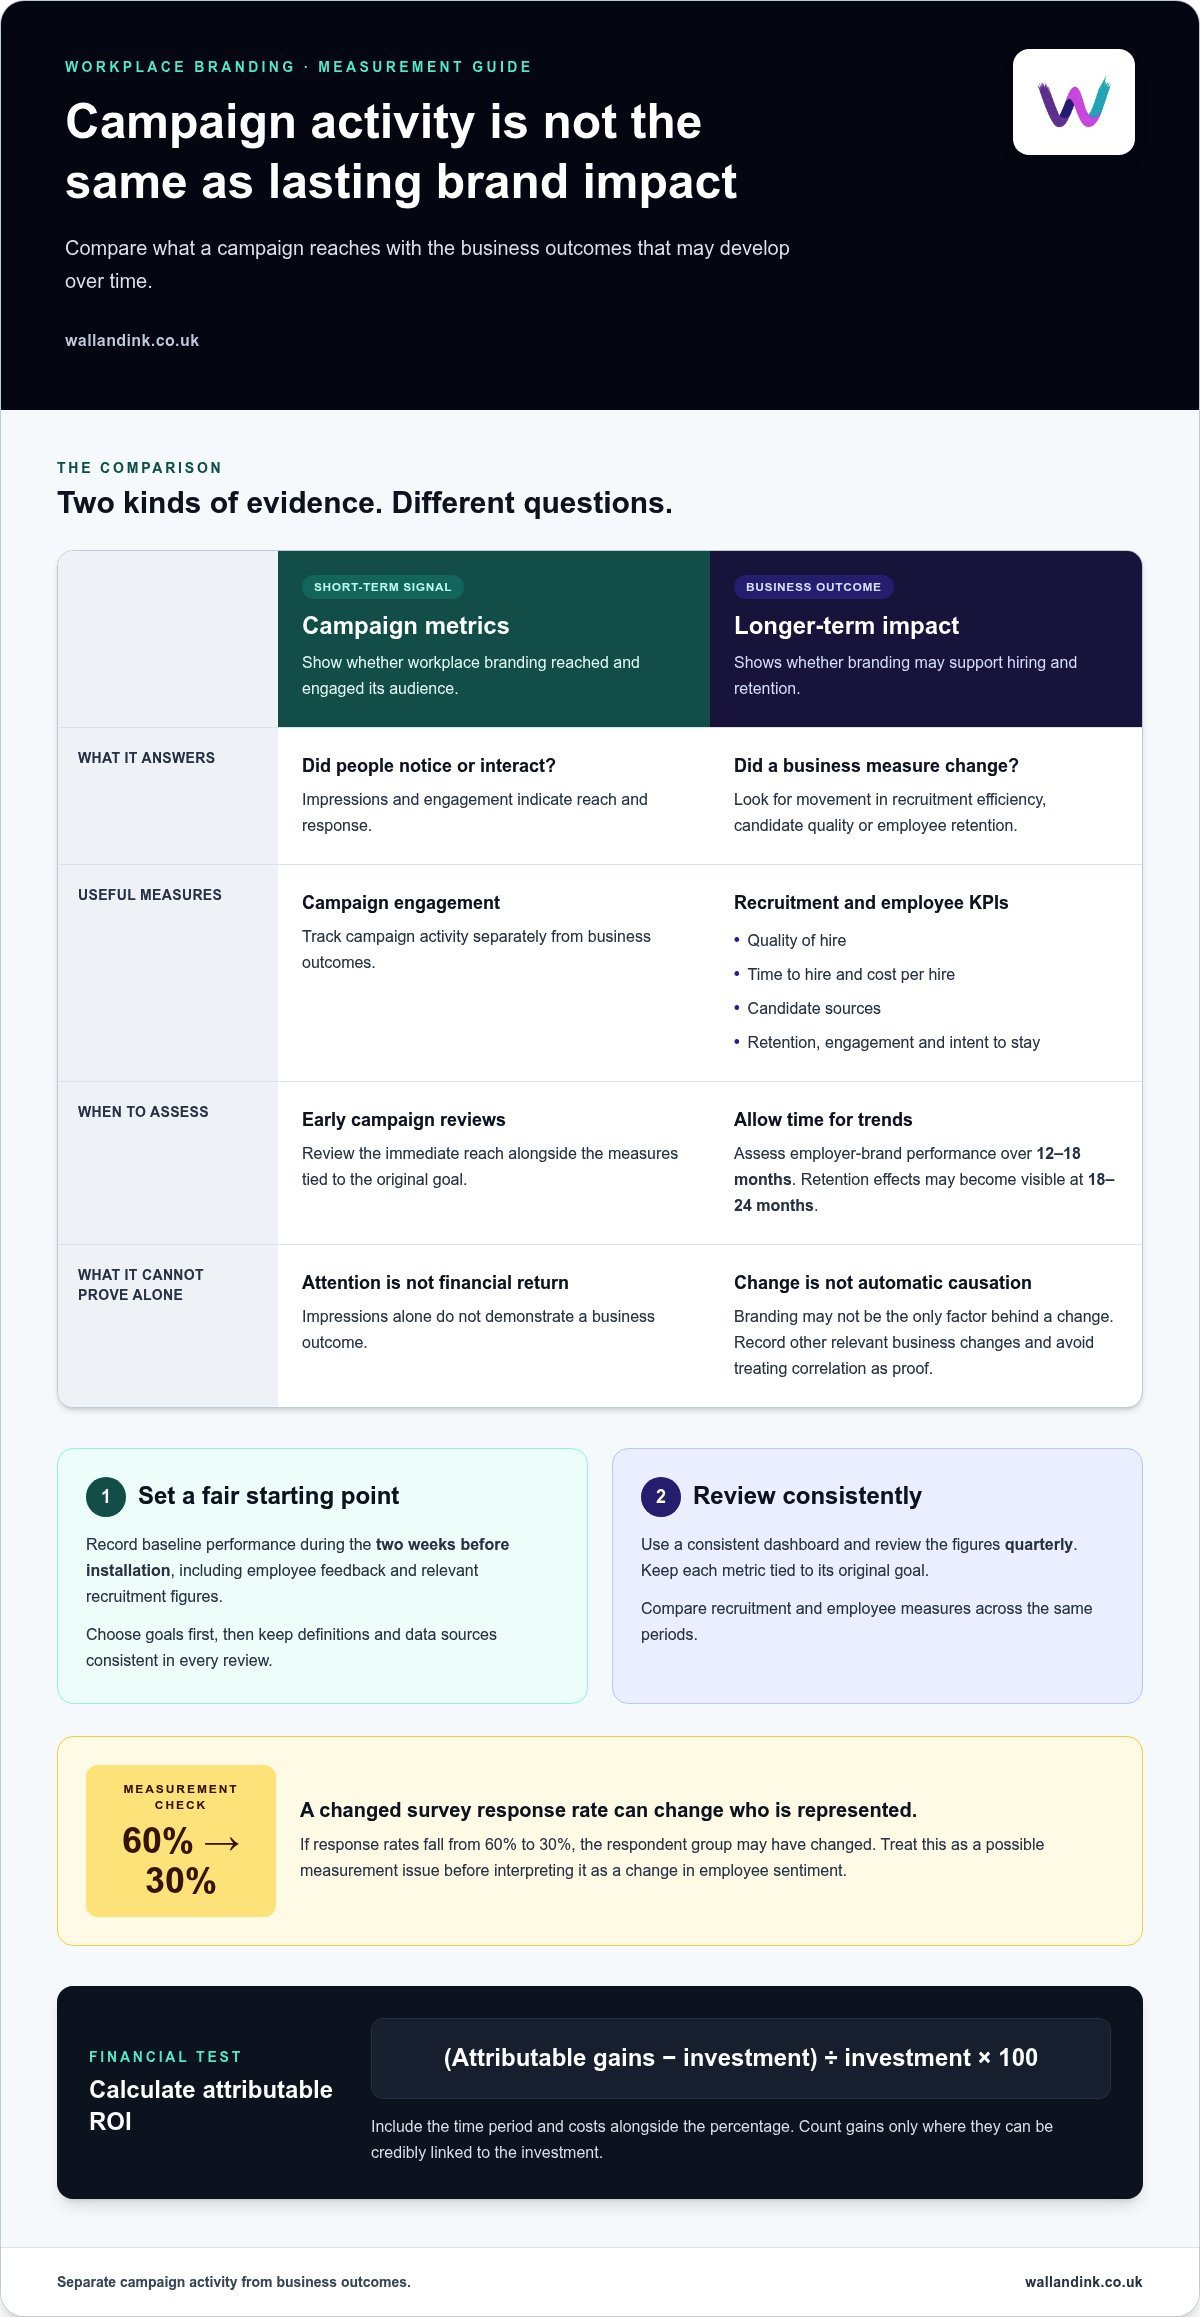
Impressions and engagement show whether a campaign reached people, but they do not reveal whether workplace branding helped the organisation retain talent or recruit more efficiently. A sound assessment starts with baseline measures and tracks campaign metrics alongside business outcomes over time.
This article explains how to compare those measures, identify defensible retention savings and build a transparent ROI calculation. Employer-brand trends are best assessed over 12 to 18 months, while retention effects may become visible at 18 to 24 months. You’ll also see which costs and outcomes to include, and how to avoid treating correlation as proof that branding alone caused a change.
Key Takeaways
- Separate campaign activity, such as impressions and engagement, from business outcomes such as retention and recruitment efficiency.
- Use a transparent ROI formula: subtract the investment from attributable gains, divide by the investment, then multiply by 100.
- Set a baseline before installation and track results over a suitable period, as retention effects can take time to emerge.
- Include the full cost of the project, including internal time, downtime, maintenance, refreshes and removal where relevant.
- Connect engagement and retention data to financial outcomes carefully, recognising that workplace branding may not be the only factor influencing change.
Campaign metrics versus long-term brand impact
Campaign metrics show whether workplace branding reached and engaged its audience; longer-term measures show whether it supports hiring and retention. Separate these types of evidence before assessing financial impact, because impressions alone do not demonstrate a business outcome.
Set a benchmark before installation, then compare later results with it. For recruitment, connect campaign activity to candidate quality, hiring efficiency and employee retention.
Goal setting and baseline performance
A baseline records relevant performance before a branding activity begins. It gives later comparisons a reference point, helping distinguish change from existing trends. For workplace branding, record baseline metrics during the two weeks before installation, including employee feedback and relevant recruitment figures.
Choose goals before selecting measures. If the priority is retaining employees, for example, track retention alongside engagement and intent to stay. If the goal is hiring efficiency, note current time to hire and cost per hire. Use the same definitions and data sources in each review, so any change reflects performance rather than a revised measurement method.
Business-aligned KPIs and metrics
Key performance indicators (KPIs) are the measures used to track progress towards a defined business goal. They matter because a campaign can attract attention without improving the outcome leaders need. Link each KPI to a specific objective, such as a stronger candidate pipeline or improved retention, and specify how it will be measured.
For recruitment, monitor quality of hire, time to hire, cost per hire and candidate sources. Source data can show which channels bring suitable applicants and help teams direct recruitment budgets more effectively. Track campaign engagement separately, then examine whether it coincides with changes in these hiring measures.
Use a consistent dashboard to compare the campaign’s immediate reach with outcomes that develop over time. Review the figures quarterly, and keep each metric tied to its original goal. If an employee survey response rate falls from 60% to 30% after installation, for example, the respondent group may have changed. Treat that shift as a possible measurement issue before interpreting the results as a change in employee sentiment.
Employer-brand performance should be assessed as a trend over 12 to 18 months, rather than by attributing individual hires to a campaign. Retention effects may become visible at 18 to 24 months, so early campaign results cannot establish the full impact. Compare recruitment and employee measures across the same periods, and record other relevant business changes alongside them.
Long-term brand effects also need careful interpretation. WARC’s 2026 analysis reports that brand-building effects can account for more than 40% of media-driven sales, but that figure concerns sales, not workplace retention. Apple and Google are cited as examples of organisations that reduced paid media spending as their employer brands strengthened. These cases illustrate why campaign activity and lasting brand impact should be considered separately, not treated as interchangeable proof of return.
Measurement can fail when the organisation lacks a clear benchmark or consistent KPIs. Gartner found that 84% of surveyed companies were caught in a brand doom loop, where weak measurement makes brand impact harder to prove. Establishing a baseline, choosing business-aligned recruitment metrics and reviewing longer-term trends creates a more credible view of performance.
Calculating ROI with a transparent formula
A transparent formula turns workplace branding outcomes into a financial comparison and clarifies which gains and costs underpin the result.
Brand strategy ROI formula
Brand strategy ROI compares attributable financial gains with the cost of the strategy. Subtract the investment from the gains, divide by the investment, then multiply by 100. This matters because it shows whether measurable value exceeded the resources committed, rather than presenting reach or engagement as financial return.
For example, a £150,000 brand strategy investment generates £300,000 in estimated measurable value over 12 months. The calculation is (£300,000 − £150,000) ÷ £150,000 × 100, producing a 100% ROI. State the time period and included costs alongside the percentage, so decision-makers can interpret the result accurately.
ROI calculation formulas
The standard ROI formula is (gain − investment cost) ÷ investment cost × 100. It matters because the same calculation can compare investments of different sizes, helping teams assess how to allocate a department’s budget.
Keep the result formatted as a percentage, fraction or ratio, not an isolated figure. A benefit-cost ratio answers a related question: how much value does each pound invested produce? For example, a ratio of 2.05 represents about two pounds of benefit for each pound of cost.
For a retention-focused analysis, define “gain” as the financial value of outcomes attributable to the activity. Possible categories include avoided replacement costs, reduced recruitment spend or lower vacancy costs. Deduct the investment cost once, then divide the net gain by that investment. This avoids a common error: reporting total benefits as ROI without subtracting the organisation’s spending.
Separate cash savings from estimated value. A lower recruitment invoice is a direct saving; improved employee engagement may contribute to productivity, but translating it into money requires a clear method. Record the assumptions behind each estimate, including which talent outcomes count and how they relate to the branding activity. If several changes happened together, do not automatically attribute every improvement to marketing.
A worked advocacy example illustrates the distinction. A £50,000 pilot is compared with £102,700 in equivalent agency and media impact. The benefit-cost ratio is 2.05. These are example figures, not a forecast for another organisation.
Ask whether the comparison uses the same period and scope on both sides. A first-year return should not be compared with benefits accumulated across several years. For workplace branding, document the chosen period, cost categories and evidence for each gain before presenting the result. For physical environments, workplace wall branding can be assessed as one defined investment within that calculation.
Defining an activity, time frame and financial outcome
Define the specific branding activity, the period assessed and the outcome before interpreting results. For office interiors, model payback over two to three years, while tracking performance for at least 12 months and ideally 24 to 36 months.
Leading indicators and financial outcomes
Leading indicators are early signals of change, while financial outcomes record measurable value, such as savings or added contribution margin. Keep them separate because activity can shift before its financial effect becomes visible.
For example, employee feedback or candidate interest may provide an early signal after a workplace change. A resulting reduction in recruitment costs or improved retention is a later outcome. Set a review schedule that follows both: signage outcomes can be assessed 30, 90 and 180 days after installation, while longer-term interior branding needs a broader payback view.
Choose one activity and connect it to a defined outcome. If a business installs workplace branding to support recruitment, compare candidate and hiring trends with the pre-installation position. If the objective is wayfinding, assess whether visitors navigate the space more effectively. Signage and wayfinding benefits often appear within 60 to 90 days after installation, whereas broader financial effects may take longer to assess.
Customer behaviour and commercial outcomes
Customer behaviour describes how people respond to a brand, while commercial outcomes show the resulting business value. An increase in attention or positive feedback does not automatically mean higher revenue.
For example, a retail business could examine whether customer feedback or repeat visits change after updating its workplace. Treat these as indicators, then connect them to revenue or contribution margin only when the data supports that link. A global retail bank example found that branches with higher Employer Brand Index scores also performed better in employee engagement, customer satisfaction and sales performance. This association offers a useful comparison, not proof that branding alone caused the results.
Keep the activity and outcome within the same measurement plan. If employer branding aims to attract candidates, track recruitment indicators separately from sales measures. If a workplace change aims to improve customer experience, specify which behaviour should shift, such as repeat visits or purchasing patterns. This prevents unrelated commercial changes from being counted as branding impact.
Time frames should match the outcome. Review near-term signage effects at 30, 90 and 180 days, then assess interior branding over the recommended two-to-three-year payback period. Track results for at least 12 months, and ideally 24 to 36 months, to capture effects beyond the initial response.
Finally, record external changes that may influence customer behaviour, including competitor activity, pricing changes or business relocation. A worked example estimates £170,000 in incremental contribution margin from an improved win rate and £50,000 in added margin from lower discounting over the following 12 months. These outcomes illustrate how commercial value can be defined, but the calculation should include only gains connected to the activity being assessed.
What costs should be included in a workplace branding investment?
Include the full cost of delivering, operating and eventually removing a workplace branding project. Omitting downtime, refresh and removal can lead teams to undercount office interior branding costs by 20-40%.
Build the cost picture around the project’s full life cycle, not just its installation invoice. Separate one-off costs from recurring expenditure, then use the same categories when comparing options or calculating payback. For a workplace installation, record costs under these headings:
- Planning and design: include research, design development, visualisation and staff time used to approve the final concept.
- Production and installation: record materials, production, delivery, access equipment and the labour required to apply the finished work.
- Operational disruption: account for areas being unavailable, staff relocation and any reduced working capacity during installation.
- Ongoing maintenance: include cleaning, repairs and other work needed to keep the installation in serviceable condition.
- Refresh and removal: allow for updating or taking down the branding when it no longer meets the organisation’s needs.
Internal labour counts even when it does not appear on a supplier invoice. For example, include the time facilities, communications and HR teams spend managing approvals, coordinating access and briefing employees. Use a consistent method to value that time, and avoid counting the same hours across multiple departments.
Downtime is another easily missed cost. If installation prevents staff using a meeting room or work area, estimate the operational effect using the organisation’s own records. The impact depends on how the space is used, whether work can move elsewhere and how long normal activity is disrupted. Record your assumptions alongside the calculation.
Recurring costs need a clear time frame. Office interior branding refreshes may occur every 3-7 years, so an installation’s initial cost alone may not represent its full cost of ownership. Include expected maintenance and refresh activity within the payback period, rather than treating each later project as unrelated. This makes comparisons between a one-off installation and an ongoing workplace programme more meaningful.
Before calculating ROI, check that each cost belongs to the activity being assessed. If a project also includes unrelated facilities work, allocate only the relevant share using a consistent basis, such as staff time or the area involved. Keep records of invoices, internal hours and operational assumptions. This audit trail shows decision-makers how the total was calculated and allows them to revise it when actual maintenance, downtime or removal costs differ from the original plan.
How can workplace branding benefits such as employee engagement and retention be quantified?
Quantify employee outcomes by linking consistent people data with financial measures. Retention, engagement, productivity, quality of hire, cost per hire and applicant numbers can all help assess employer-brand performance.
Start with a defined objective, such as improving intent to stay, then select measures that show progress. Use staff surveys and exit interviews to understand employee views and reasons for leaving. Compare results over time using consistent questions and definitions. Employee engagement and satisfaction data can also show whether staff experiences align with the organisation’s stated employer brand.
The Employer Brand Index measures whether employees believe their organisation delivers on its employee value proposition, including engagement, advocacy and intent to stay. Comparing those measures with recruitment and retention data adds context. If scores rise while regretted departures fall, examine whether the timing and employee groups align before assigning financial value.
Retention savings can be estimated by multiplying the number of avoided replacements by the cost of replacing an employee. Replacement costs are estimated at between 90% and 200% of annual salary. Use your organisation’s salary and recruitment records to model the relevant cost, rather than treating the full range as a guaranteed saving. Separate direct recruitment expenditure from less tangible effects, such as lost productivity during a vacancy.
LinkedIn research reports that strong employer brands lower turnover by 28% and can reduce cost per hire by up to 50%. These findings offer context, not a substitute for measuring your own workforce. Track voluntary turnover, cost per hire and employee engagement together, then review whether they move alongside the workplace branding activity.
Build a repeatable measurement process. Set KPIs, collect data at regular intervals and compare results with the original baseline. Record changes to management, pay, workload or business structure, as each can influence engagement and retention. An integrated approach helps distinguish a broader trend from the effect of one workplace initiative.
Interpret productivity carefully. Employer branding can help organisations hire suitable people, retain them longer and support engagement, but productivity gains are difficult to attribute. Line managers also influence performance. Compare team-level data over time and document other operational changes before including productivity in an ROI estimate.
For a physical workplace update, connect the environment to a clear employee objective, then measure staff feedback and retention trends separately. Explore workplace wall branding as one way to make the organisation’s identity visible in its working environment.
Wall & Ink: Direct-to-Wall Printing
Wall & Ink creates custom workplace graphics with Direct-to-Wall Printing and Commercial Wall Murals. If your measurement plan points to a need for a clearer, more consistent workplace environment, these services can bring your organisation’s identity directly into the space. Define the project as a distinct investment, then assess its costs and employee outcomes using the approach set out above.
Direct-to-Wall Printing applies artwork directly to a wall, while a Commercial Wall Mural can create a visual feature in a shared workplace. The right approach depends on the space, intended message and surfaces involved. Treat the installation as one part of a broader employee experience, not as proof of improved retention on its own.
To discuss a workplace mural or Direct-to-Wall Printing, contact Wall & Ink.
Turn your workplace insight into a considered next step
A disciplined approach to calculating ROI on workplace branding can inform more than a budget decision. It can help shape an environment that reflects your organisation’s identity and supports the experience you want employees to have. Consider how the physical space can make that identity visible, from shared work areas to more focused rooms.
Wall & Ink offers Direct-to-Wall Printing and Commercial Wall Murals for business environments, alongside Residential Wall Art. The right format depends on the space, message and surfaces involved. A clear brief gives the project a practical starting point and helps connect the visual outcome with your workplace objectives.
If you’re ready to explore a workplace branding project, discuss your plans with Wall & Ink. A considered environment can give your brand a more tangible presence at work.
Wall & Ink and Workplace Branding ROI
Wall & Ink offers Direct-to-Wall Printing and Commercial Wall Murals for workplace environments. Once you have assessed how workplace branding supports your goals, these services offer a practical way to bring that branding onto your walls.
For other spaces or applications, Wall & Ink also offers Residential Wall Art, School and Educational Murals, Retail and Hospitality Graphics, and Exterior Wall Printing.
Frequently Asked Questions
From vanity metrics to value metrics: what should you measure?
Measure whether attention leads to a meaningful employee or business response, not just how many people saw a campaign. For example, compare careers-page visits with completed applications, then examine whether applicants progress through hiring. For an internal initiative, pair participation or feedback with retention patterns. Treat impressions and reactions as diagnostic signals: they help explain reach, but do not establish business value by themselves.
The business case: what’s at stake?
The business case is whether the investment supports outcomes the organisation values, such as retaining skilled employees or improving recruitment efficiency. Without a clear link, leaders may fund activity that generates attention but does not address a workforce need. A useful assessment also identifies trade-offs: an initiative may improve employee experience without producing an immediate cash saving. State the intended benefit and how it contributes to organisational priorities before assessing the result.
Which metrics should you use?
Choose metrics that match the objective and the decision you need to make. For recruitment, compare applicant progression by source, offer acceptance and new-starter performance. For retention, examine voluntary departures by role or team alongside survey feedback and exit-interview themes. Segmenting results can reveal whether an overall average hides different experiences across departments. Keep definitions consistent, so changes in reporting practice do not appear to be changes in performance.
How do you calculate ROI on workplace branding?
Use ROI = (attributable gains minus total investment) ÷ total investment × 100. Count gains only once, and include relevant design, delivery and internal costs. Label estimates clearly, and show the measurement period beside the result.
How can workplace branding affect recruitment costs and time to hire?
Workplace branding may support recruitment by helping candidates understand the organisation’s identity and working environment. To assess any effect, compare recruitment-source mix, agency use, cost per hire and time to hire before and after the activity. Check whether roles and hiring conditions are comparable. For instance, faster hiring during a period with fewer vacancies does not by itself show that branding improved recruitment efficiency.
What metrics can measure the impact of workplace branding on productivity and absenteeism?
Compare relevant operational measures, such as completed work, output quality, absence patterns and employee feedback, over a consistent period. Select measures the organisation already uses reliably, and interpret them alongside changes in workload, staffing and management. For example, a team’s output may rise after a workplace change, but revised processes could also explain the increase. Record these factors before linking observed changes to branding.
How do you attribute business outcomes to workplace branding rather than other factors?
Use a comparison that helps distinguish the initiative’s contribution from wider changes. Where practical, compare similar teams or locations with different implementation timings, while keeping other conditions in view. Track when the activity started and when outcomes shifted. Also record changes such as restructuring, pay adjustments or new managers. If several factors changed together, report the relationship cautiously rather than treating timing alone as proof of causation.
What steps and tools can be used to track workplace branding ROI over time?
Keep a simple, consistent record: define the objective, log investment and implementation dates, capture relevant HR and finance measures, then review the dashboard quarterly. Staff surveys, exit interviews, recruitment records and absence reports can provide complementary evidence. Use one set of metric definitions across reviews, and note missing or changed data sources. This makes trends easier to interpret and gives decision-makers a traceable record of how each estimate was formed.